SIGNAL LOSS
The client's strategic 'Onboard & Inform' initiative required precise tracking across multiple channels, but executive leadership lacked a unified view. Critical KPIs—like TRP, Open Rates, and Conversion targets—were buried in static reports. The C-Suite needed to track the campaign's pulse without waiting for manual data consolidation.
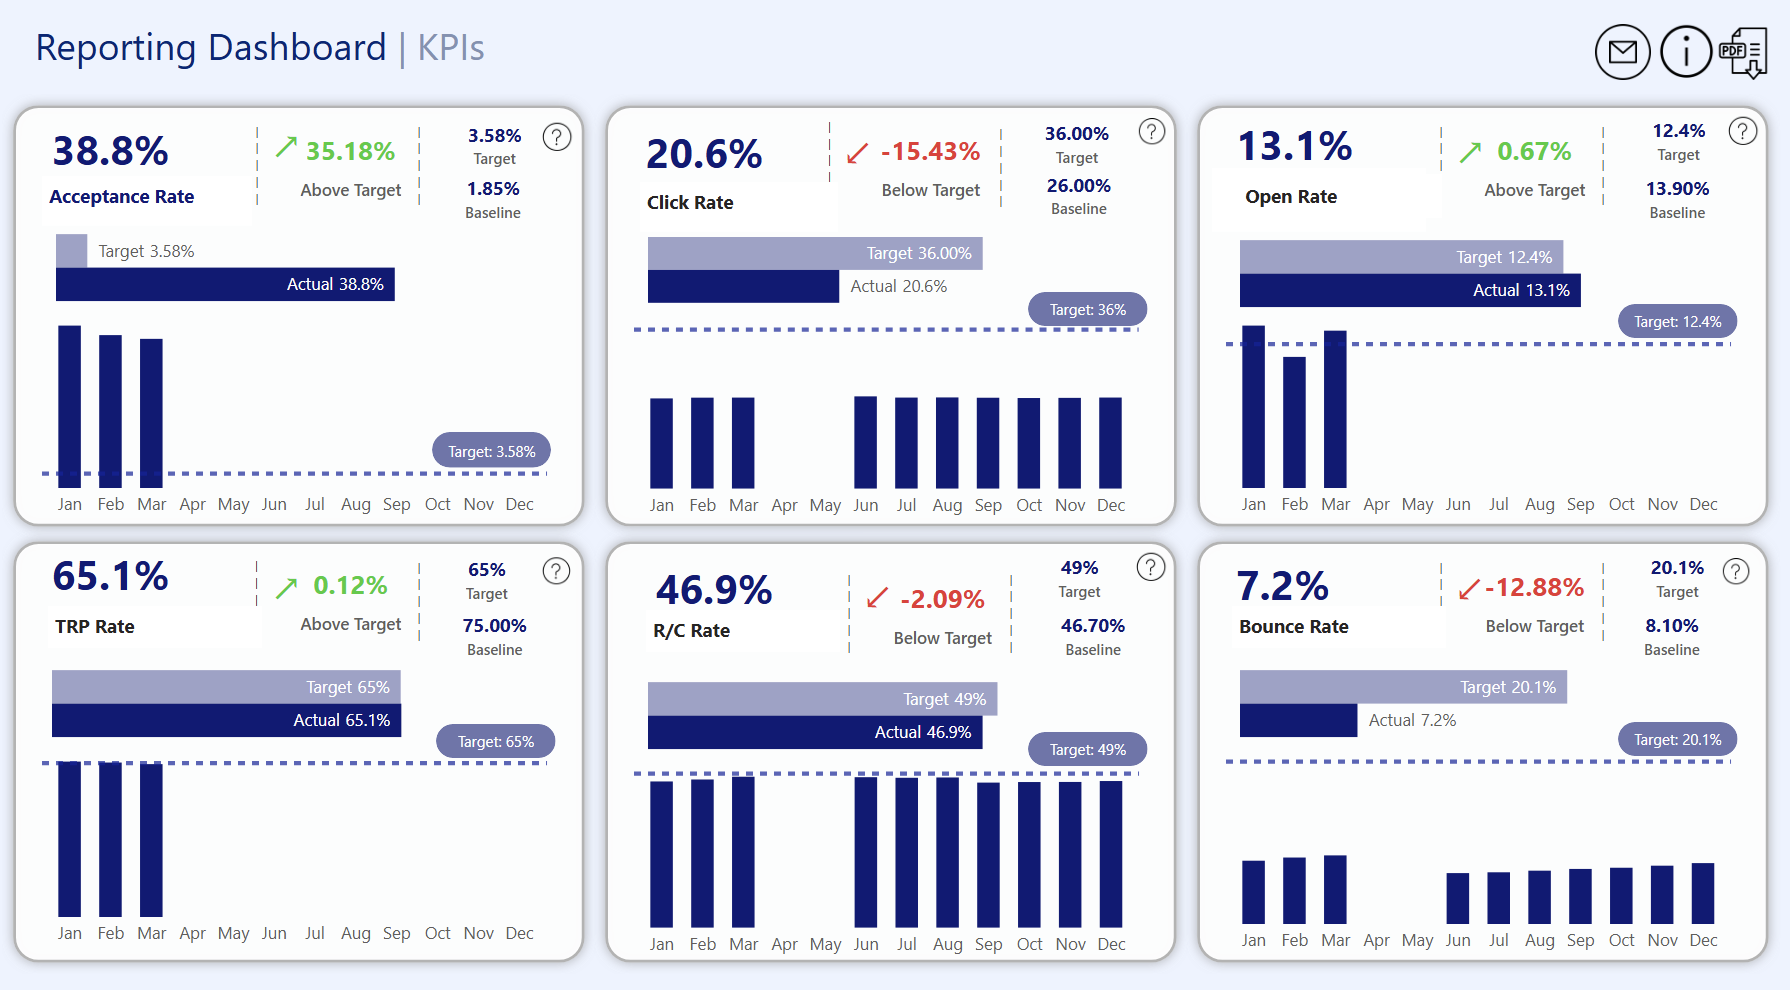
THE ARCHITECTURE
We designed a streamlined Power BI interface that translates raw campaign data into executive-ready signals.
- KPI Triangulation: The dashboard instantly visualizes Month-Over-Month trends against forecasting targets, allowing leadership to drill down from high-level 'Acceptance Rates' to specific channel performance.
- Automated Variance Tracking: We removed manual analysis. The system automatically calculates variance against the baseline, flagging underperforming metrics (like 'Bounce Rate') in real-time.
- Presentation-Ready Delivery: Data refresh is automated, ensuring Monday morning email delivery contains the exact state of the campaign with zero manual prep.
CAMPAIGN VELOCITY
By automating the logic between the data source and the decision-maker, we cut reporting time by 75%. Leadership now visualizes 6-month performance trends in a single click, shifting the conversation from 'Where is the data?' to 'How do we optimize?'
"The system paid for itself in the first week."
— VP of Operations, UnitedHealthcare